Add styles
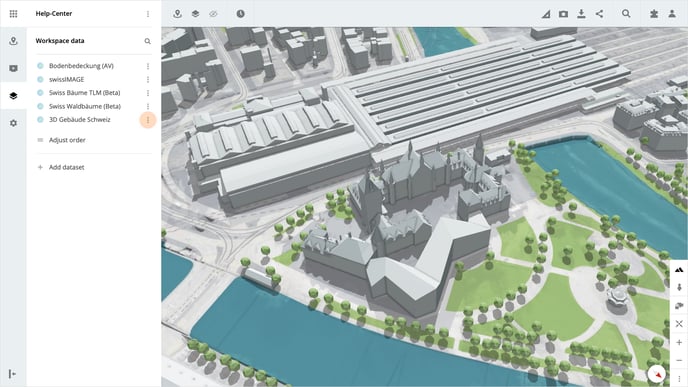
Open the workspace data in your workspace and open the context menu of the desired 3D dataset.
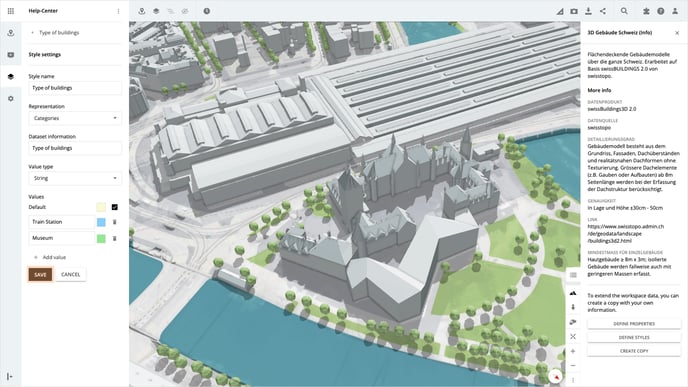
Click on Define Styles in the menu and then click on the Add Style button. For each style, you can enter a title in the input field Style name and select the criteria according to which you would like to display the information in the drop-down list.
Please note, that if the desired 3D dataset has been added from the marketplace, you must first create a copy.
Presentation
- If you select Categories, a simple text field is available for entering the information.
- If you select Intervals, a numeric input field is available for entering the information.
- If you select Custom, you can add your own style definition as JSON. You can find documentation on this here.
Information of the dataset
In the input field Dataset information, you can now enter the information for which you want to define the style. If you have already added information to your dataset, it will automatically be available for selection.
Please note that for the styles, the 3D data must first be enriched with your own information. Read here how you can add your own information to datasets.
Values
In addition to the standard value, create other values by clicking on the button Add value. For each value, you can assign a name and determine the color and transparency.
View styles
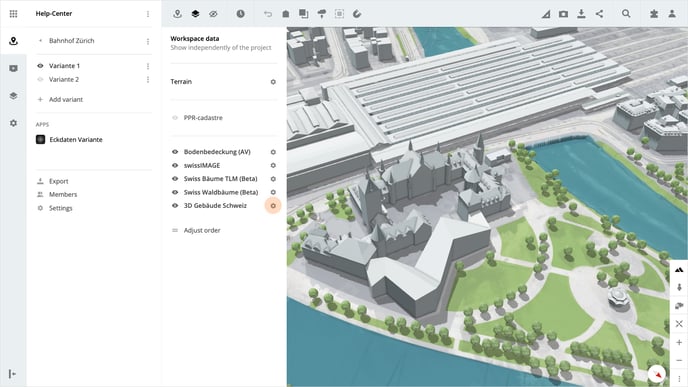
Open a project in which the completed dataset is available. To call up the styles, click on Show workspace data in the toolbar at the top. Then click on the dataset settings for the desired dataset. After that you can select your created style in the dropdown Styles, the map will be adjusted automatically.
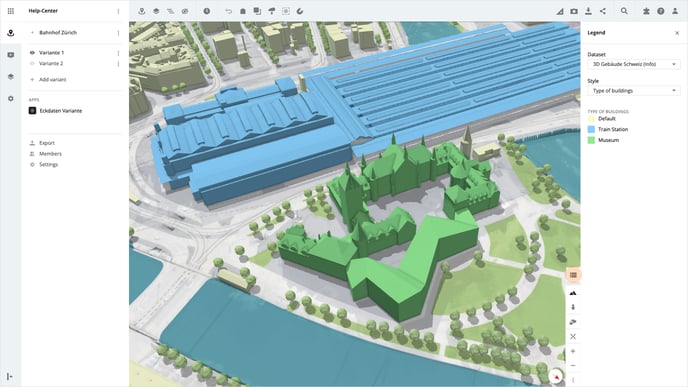
In addition, you can open the legend on the right-hand side. You can easily switch between the datasets and styles here by selecting the desired datasets and styles in the two dropdowns Dataset and Style.
Is there anything we could change to make this article helpful?